Quick Setup Guide of Uptime Kuma Monitoring
Uptime Kuma is your reliable performance monitoring companion. This powerful tool keeps a vigilant watch over your website and instantly alerts you about any availability issues. This quick setup guide describes how to configure website monitoring.
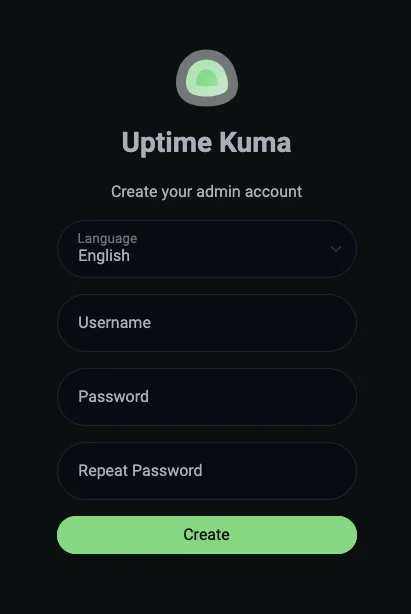
Step 1: Creating admin account
To begin using Uptime Kuma, go to the address you provided during checkout (your_address.uptimekuma.eu).
- If this is your first visit, you will be prompted to create an administrator account. Enter your username and admin password and click “Create” to complete the setup
- If you did not specify a custom address in the “notes” field during checkout submit a support ticket in our help system to request one.
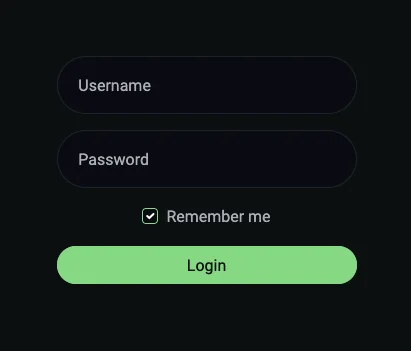
You can now log in when accessing the Uptime Kuma website again
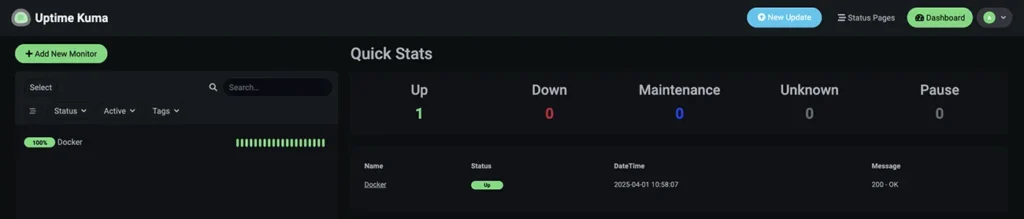
Step 2: Dashboard
Once you’ve set up your administrator account and logged in, you’ll see the Uptime Kuma main dashboard. This is where you can:
- Check the status of all your monitored services
- View quick statistics and event logs
- Manage your monitoring setup
Since you haven’t configured any monitors yet, there’s no data to display.
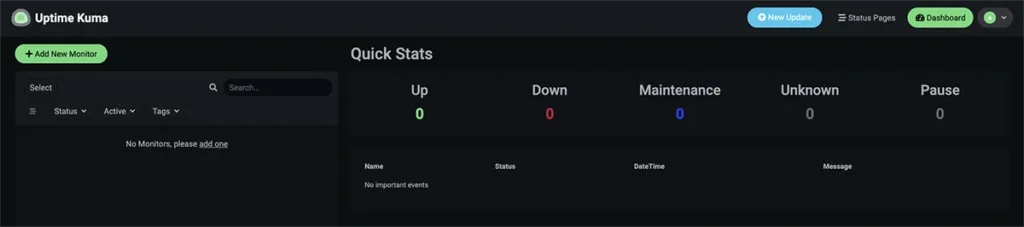
Step 3: Adding a New Monitor
Now you can add your first monitor. To do this, simply click the “Add Monitor” button located in the upper left corner of the dashboard. A form will appear where you can start entering the details of the service you want to monitor.
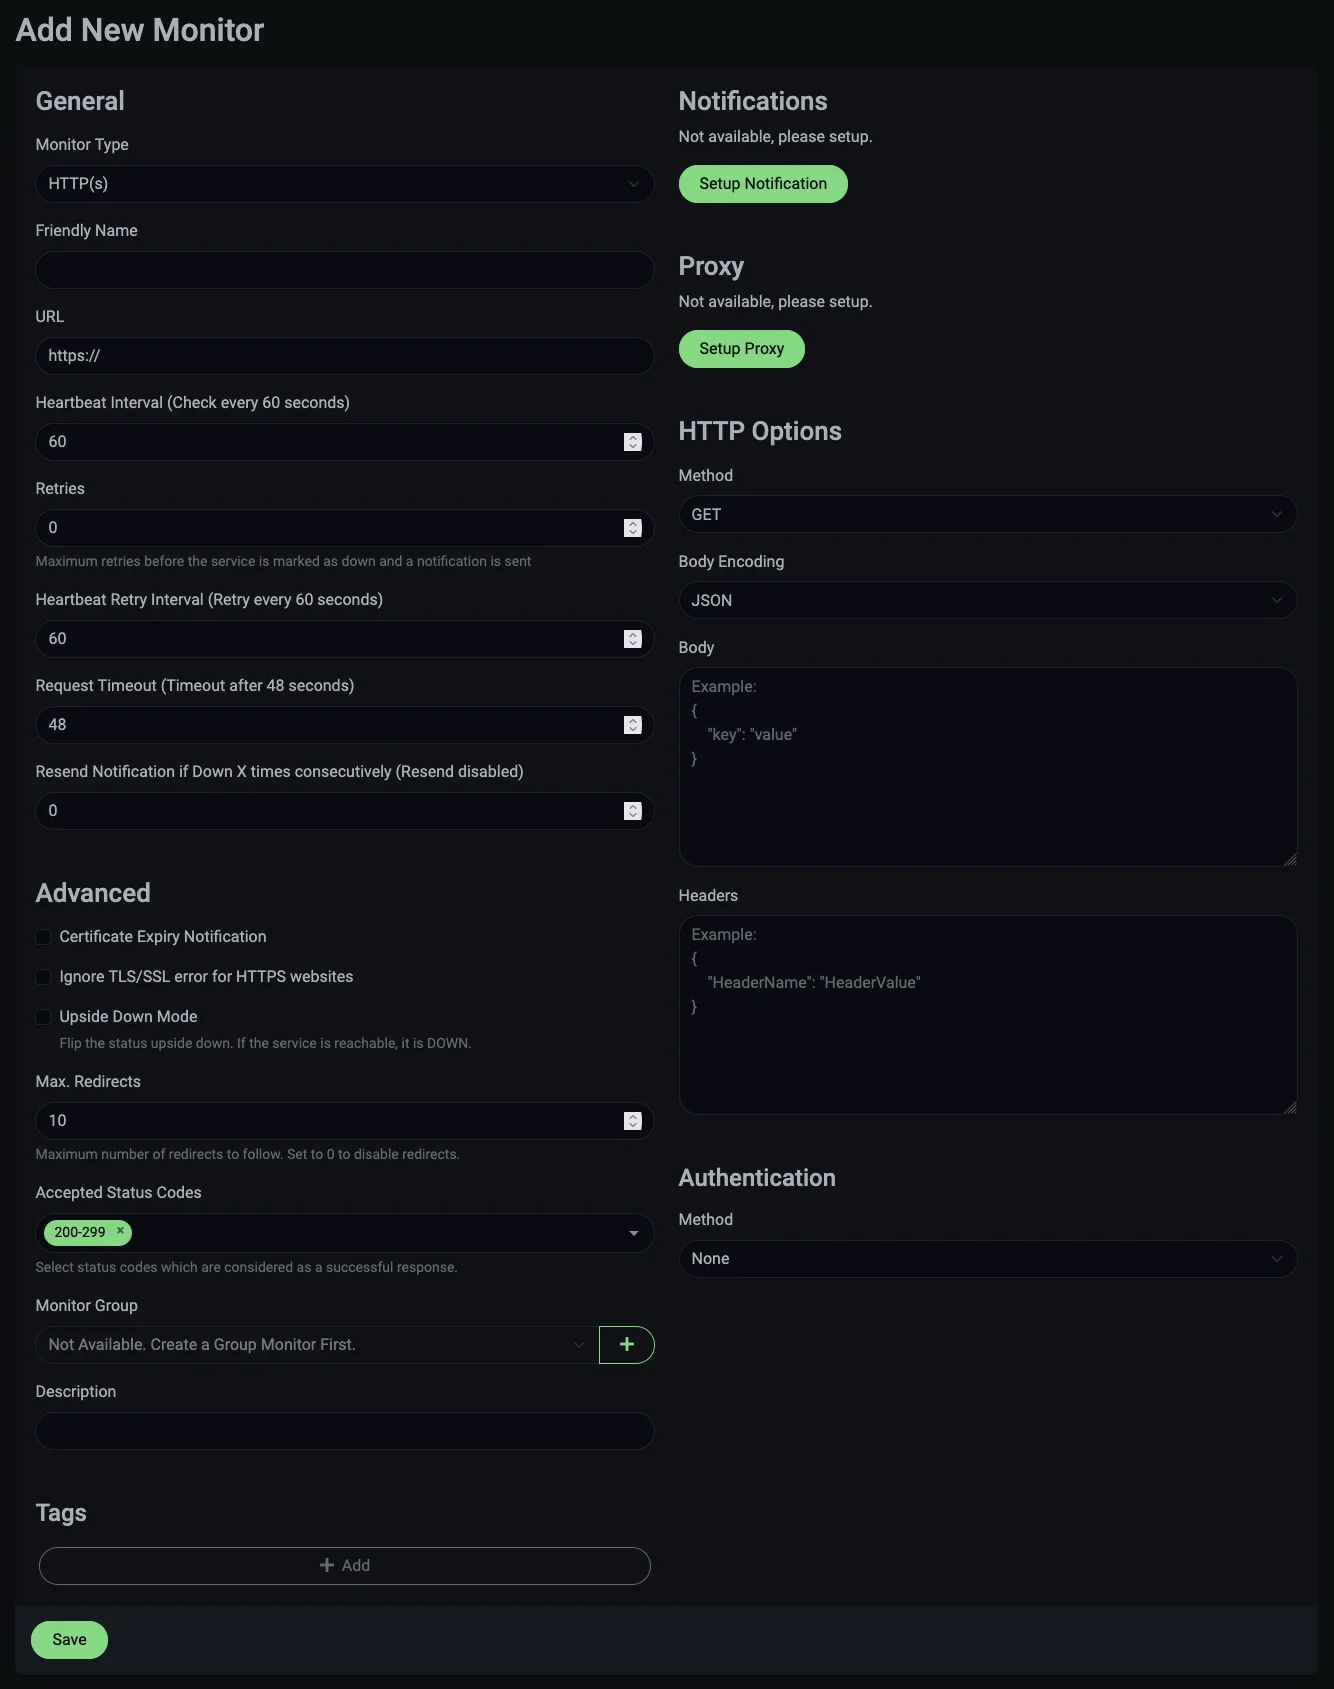
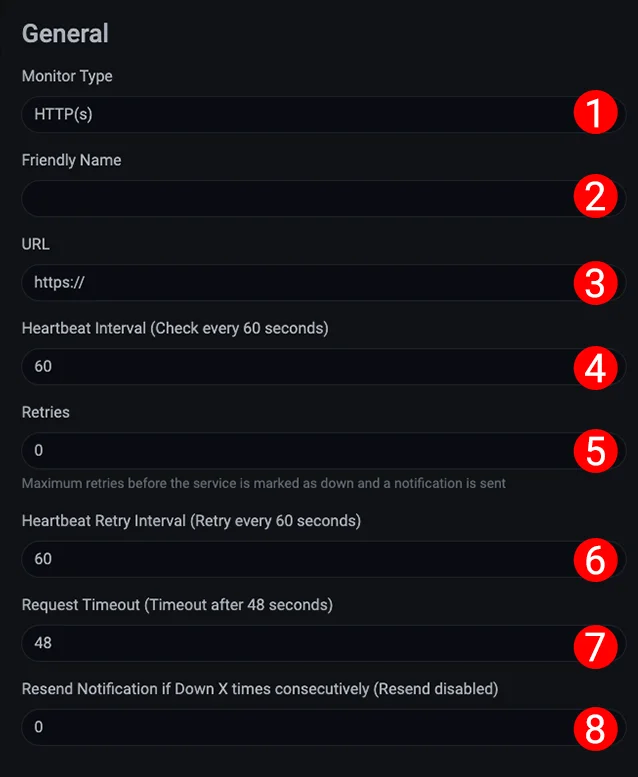
General section
The first section of the form is General, where you’ll enter basic details about your service and monitoring settings:
- 1 – Monitor type – select the type of service you want to monitor. For any website-based service, choose the Http(s) option.
- 2 – Friendly Name – name your service here – this will be shown in Uptime Kuma’s dashboard.
- 3 – URL – provide the URL of the service you want to monitor.
- 4 – Heartbeat Interval – choose how often (in seconds) Uptime Kuma should test your service. This impacts the statistical data timeframe.
- 5 – Retries – maximum retry attempts before marking the service as down and triggering an alert.
- 6 – Heartbeat Retry Interval – decide how frequently to recheck if your service isn’t responding.
- 7 – Request Timeout – maximum allowed response time before declaring service unavailable
- 8 – Resend Notification if Down X times consecutively – Specify the number of failed checks needed to send another alert.
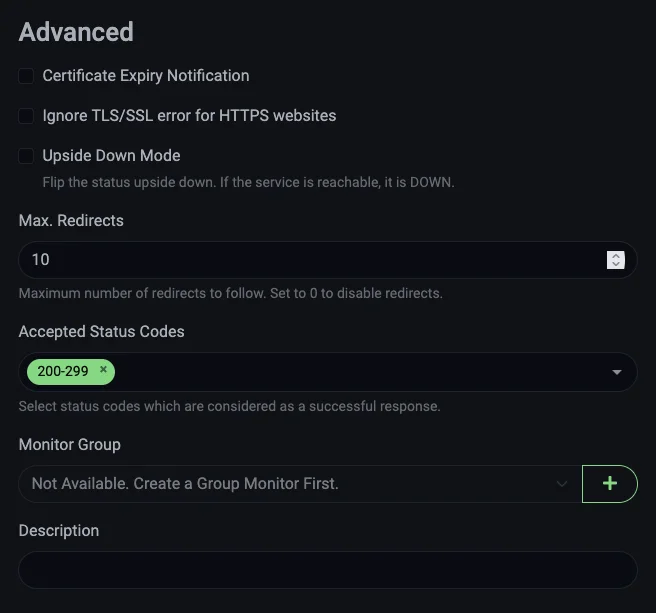
Advanced section
Here you can set up advanced monitoring options like getting alerts for expiring certificates, choosing to skip HTTPS security checks, deciding how many redirects to allow, and specifying which status codes are acceptable. You can also organize monitors into groups and add notes.
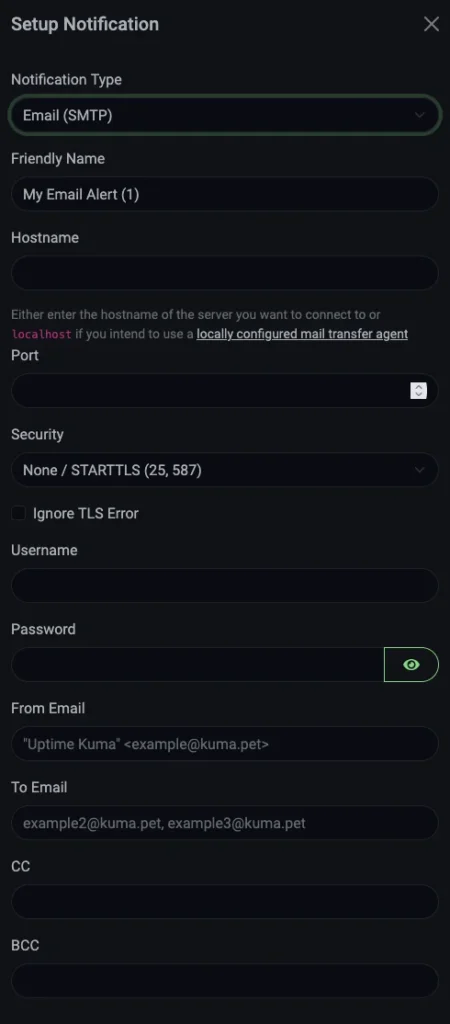
Notifications section
Here you can set up how you’ll get alerts when your service goes down. Just click “Setup Notification”, pick how you want to be notified, and fill in the needed details.
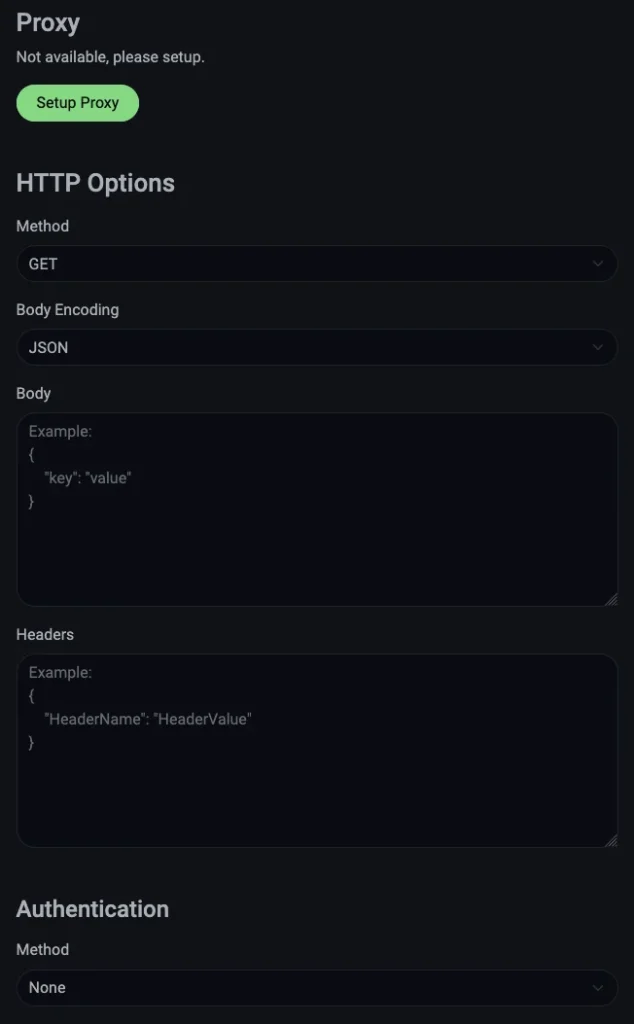
Other sections
If you want to configure more advanced options, such as proxy settings, HTTP parameters, or authentication, you can do so here.
Once you’ve entered all your settings, click the “Save” button at the bottom of the form. This will add your service for monitoring, and it will appear on the main Uptime Kuma dashboard.
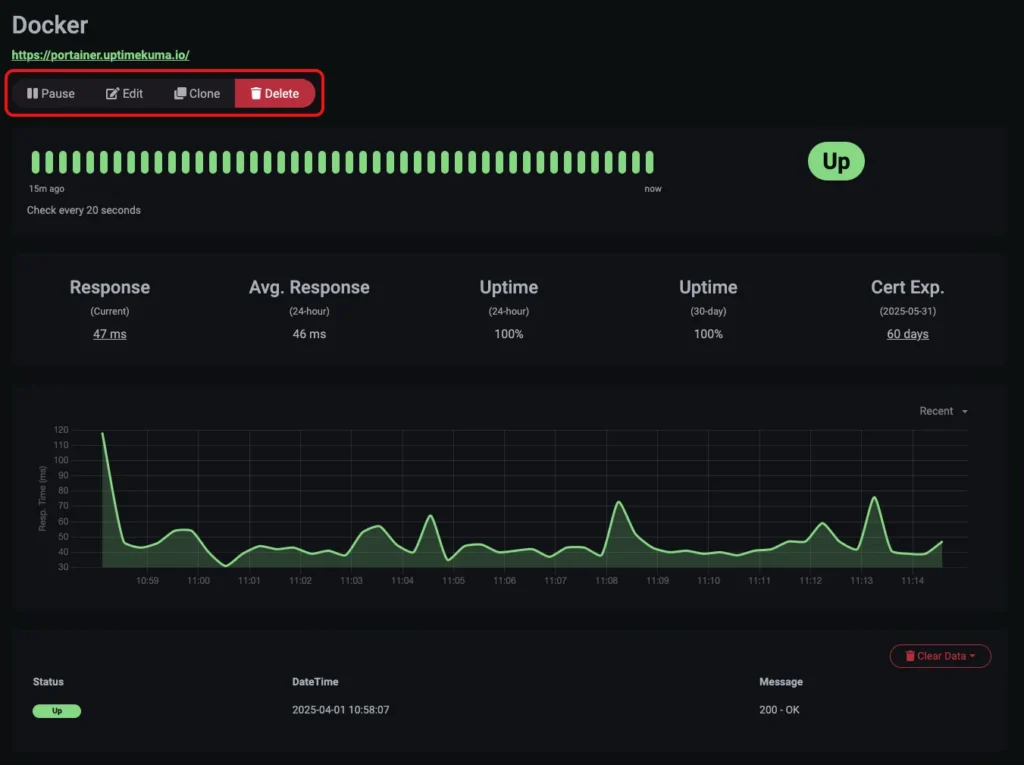
Step 4: Reviewing Metrics and Adjusting Preferences
Once your service is properly set up, monitoring data will appear. Click its name in the sidebar to access stats, adjust settings, pause checks, duplicate, or remove the service.